Our newest benchmark compares price, performance and differentiated features for Redshift, Snowflake, BigQuery, Databricks and Synapse.
Over the last two years, the major cloud data warehouses continue to make incremental improvements that give customers faster performance and lower cost. Contrary to popular belief, these vendors] make ongoing efficiency improvements that save customers money despite the short-term impact on revenue[1]. With the major vendors in a near-tie for performance, customers should focus on the user experience when choosing a data warehouse.
Fivetran is a data pipeline that syncs data from apps, databases and file stores into our customers’ data warehouses. The question we get asked most often is, “What data warehouse should I choose?” In order to better answer this question, we partnered with Brooklyn Data Co. to compare the speed and cost of five of the most popular data warehouses:
- Amazon Redshift
- Snowflake
- Google BigQuery
- Databricks
- Azure Synapse
Benchmarks are all about making choices: What kind of data will I use? How much? What kind of queries? How you make these choices matters a lot: Change the shape of your data or the structure of your queries and the fastest warehouse can become the slowest. We’ve tried to make these choices in a way that represents a typical Fivetran user, so that the results will be useful to the kind of company that uses Fivetran.
A typical Fivetran user might sync Salesforce, JIRA, Marketo, Adwords and their production Oracle database into a data warehouse. These data sources aren’t that large: A typical source will contain tens to hundreds of gigabytes. They are complex: They contain hundreds of tables in a normalized schema, and our customers write complex SQL queries to summarize this data.
What data did we query?
We generated the TPC-DS[2] data set at 1TB scale. TPC-DS has 24 tables in a snowflake schema; the tables represent web, catalog and store sales of an imaginary retailer. The largest fact table had 4 billion rows[3].
What queries did we run?
We ran 99 TPC-DS queries[4] in May-October of 2022. These queries are complex: They have lots of joins, aggregations and subqueries. We ran each query only once, to prevent the warehouse from caching previous results. Queries ran sequentially, one at a time, which is different than a typical real-world use case where many users run queries concurrently.
How did we configure the warehouses?
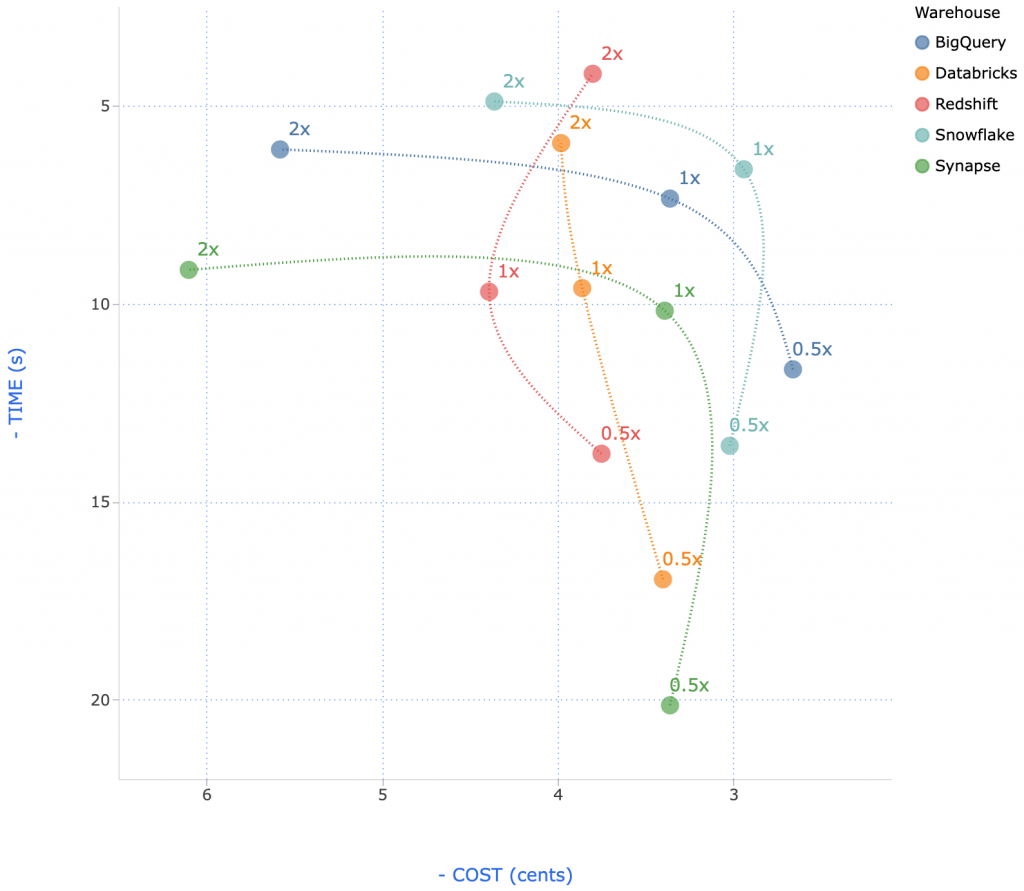
We ran each warehouse in 3 configurations, in order to explore the cost-performance trade-off.
| Configuration | Cost/Hour | |
| Redshift | 3x ra3.4xlarge (0.5x) | $9.78 |
| 5x ra3.4xlarge (1x) | $16.30 | |
| 10x ra3.4xlarge (2x) | $32.60 | |
| Snowflake[5] | Medium (0.5x) | $8.00 |
| Large (1x) | $16.00 | |
| XLarge (2x) | $32.00 | |
| Databricks[6] | 4x i3.2xlarge + i3.4xlarge driver (0.5x) | $7.22 |
| 8x i3.2xlarge + i3.8xlarge driver (1x) | $14.45 | |
| 16x i3.2xlarge + i3.8xlarge driver (2x) | $24.08 | |
| Synapse | DW500c (0.5x) | $6.00 |
| DW1000c (1x) | $12.00 | |
| DW2000c (2x) | $24.00 | |
| BigQuery | 300 slots (0.5x) | $8.22 |
| 600 slots (1x) | $16.44 | |
| 1200 slots (2x) | $32.88 |
Making cost comparisons between systems is challenging because each system offers different features that can be used to lower cost. These figures do not reflect the benefit of:
- Databricks spot-instance pricing.
- Snowflake multi cluster auto-scaling.
- BigQuery on-demand pricing.
These and other platform-specific features can be used to reduce costs for many workloads.
How did we tune the warehouses?
These data warehouses each offer advanced features like sort keys, clustering keys and date partitioning. We chose not to use any of these features in this benchmark[7]. We did apply column compression encodings in Redshift and column store indexing in Synapse; Snowflake, Databricks and BigQuery apply compression automatically.
Results

All warehouses had excellent execution speed, suitable for ad hoc, interactive querying[8]. To calculate cost, we multiplied the runtime by the cost per second of the configuration.
How much has performance improved?
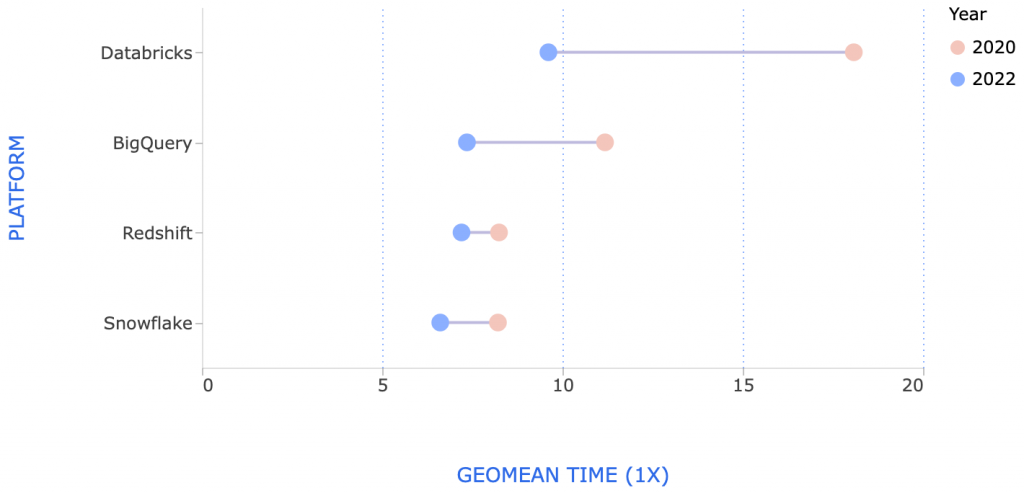
We performed the same benchmark in 2020. Performance of all systems has improved in the last 2 years[9]:

Databricks made the largest improvements, which is not surprising since they completely rewrote their SQL execution engine.
Why are our results different from previous benchmarks?
In November 2021, Databricks published an official TPC-DS benchmark showcasing the performance of their new “Photon” SQL execution engine. They also published a comparison of Databricks to Snowflake, finding their system to be 2.7x faster and 12x cheaper. There are many differences in Databricks’ benchmark compared to ours:
- They used a 100 TB dataset, while we used a 1 TB dataset.
- They used a 4XL endpoint, while we used an L endpoint.
- They used date partitioning in some tables, for both Databricks and their comparison to Snowflake.
- They ran the “analyze” command immediately after loading to update column statistics.
- Databricks reported total runtime while we reported geomean runtime. Total runtime is dominated by the longest-running queries, while geomean gives equal weight to all queries.
Databricks published the code to reproduce their benchmark on the TPC-DS website, which is very helpful for understanding the key differences between our benchmark and theirs.
In April 2019, Gigaom ran a version of the TPC-DS queries on BigQuery, Redshift, Snowflake and Azure SQL Data Warehouse. This benchmark was sponsored by Microsoft. They used 30x more data (30 TB vs 1 TB scale). They configured different-sized clusters for different systems, and observed much slower runtimes than we did:
| System | Cluster Cost | Cost/Hour |
| Azure SQL DW | $181 / hour | 15.60 |
| Redshift | $144 / hou | 18.45 |
| Snowflake | $128 / hour | $28.40 |
| BigQuery | $55 / hour | $101.22` |
It’s strange that they observed such slow performance, given that their clusters were 5–10x larger but their data was only 3x larger than ours.
Amazon’s Redshift vs. BigQuery benchmark
In October 2016, Amazon ran a version of the TPC-DS queries on both BigQuery and Redshift. Amazon reported that Redshift was 6x faster and that BigQuery execution times were typically greater than one minute. The key differences between their benchmark and ours are:
- They used a 10x larger data set (10TB versus 1TB) and a 2x larger Redshift cluster ($38.40/hour versus $19.20/hour).
- They tuned the warehouse using sort and dist keys, whereas we did not.
- BigQuery Standard-SQL was still in beta in October 2016; it may have gotten faster by late 2018 when we ran this benchmark.
Benchmarks from vendors that claim their own product is the best should be taken with a grain of salt. There are many details not specified in Amazon’s blog post. For example, they used a huge Redshift cluster — did they allocate all memory to a single user to make this benchmark complete super-fast, even though that’s not a realistic configuration? We don’t know. It would be great if AWS would publish the code necessary to reproduce their benchmark, so we could evaluate how realistic it is.
Periscope’s Redshift vs. Snowflake vs. BigQuery benchmark
Also in October 2016, Periscope Data compared Redshift, Snowflake and BigQuery using three variations of an hourly aggregation query that joined a 1-billion row fact table to a small dimension table. They found that Redshift was about the same speed as BigQuery, but Snowflake was 2x slower. The key differences between their benchmark and ours are:
- They ran the same queries multiple times, which eliminated Redshift’s slow compilation times.
- Their queries were much simpler than our TPC-DS queries.
The problem with doing a benchmark with “easy” queries is that every warehouse is going to do pretty well on this test; it doesn’t really matter if Snowflake does an easy query fast and Redshift does an easy query really, really fast. What matters is whether you can do the hard queries fast enough.
Periscope also compared costs, but they used a somewhat different approach to calculate cost per query. Like us, they looked at their customers’ actual usage data, but instead of using percentage of time idle, they looked at the number of queries per hour. They determined that most (but not all) Periscope customers would find Redshift cheaper, but it was not a huge difference.
Mark Litwintschik’s 1.1 Billion Taxi Rides benchmarks
Mark Litwintshik benchmarked BigQuery in April 2016 and Redshift in June 2016. He ran four simple queries against a single table with 1.1 billion rows. He found that BigQuery was about the same speed as a Redshift cluster about 2x bigger than ours ($41/hour). Both warehouses completed his queries in 1–3 seconds, so this probably represents the “performance floor”: There is a minimum execution time for even the simplest queries.
Conclusion
These warehouses all have excellent price and performance. We shouldn’t be surprised that they are similar: The basic techniques for making a fast columnar data warehouse have been well-known since the C-Store paper was published in 2005. These data warehouses undoubtedly use the standard performance tricks: columnar storage, cost-based query planning, pipelined execution and just-in-time compilation. We should be skeptical of any benchmark claiming one data warehouse is dramatically faster than another.
The most important differences between warehouses are the qualitative differences caused by their design choices: Some warehouses emphasize tunability, others ease of use. If you’re evaluating data warehouses, you should demo multiple systems, and choose the one that strikes the right balance for you.


